When it comes to making critical business decisions and monitoring your activities – real-time reports are a vital asset. With ePlane’s Stats & Analytics dashboard, you can quickly drill down into your day-to-day activities, as well as industry trends & benchmarks – with brilliant data visualizations, for free.
We also kept in mind that different teams need different things at different times, so we made it flexible and easy to grasp. With ePlane’s Stats & Analytics dashboard, you can easily filter & dive into the insights that are relevant to you and your team, having the most dynamic & advanced reports at your fingertips.

Need help to get started? No worries! Here is a quick dashboard review:
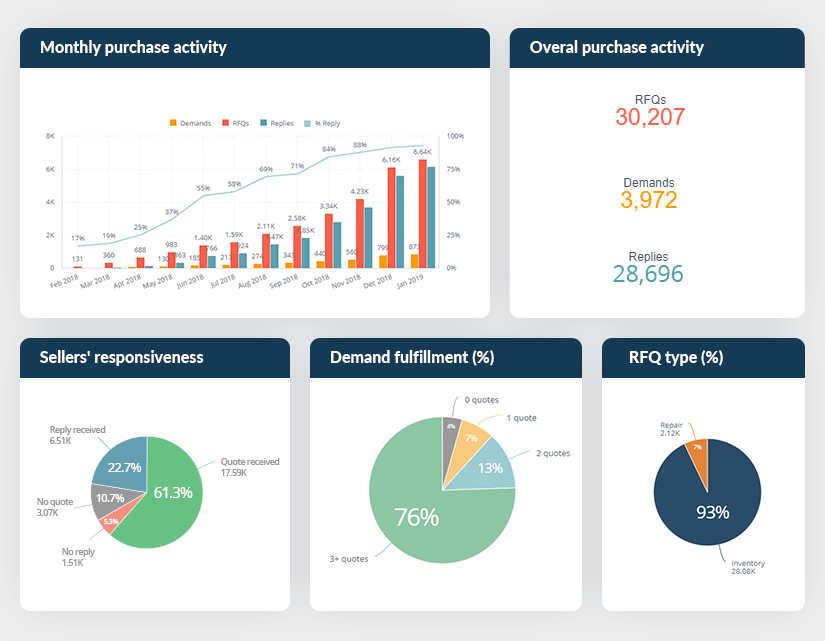
Buyers purchase report
These real-time graphs allow you to analyze your daily purchasing activities: demands, RFQs, quotes, and replies. You can also drill down to view each seller’s response, quotes for each part, and more.


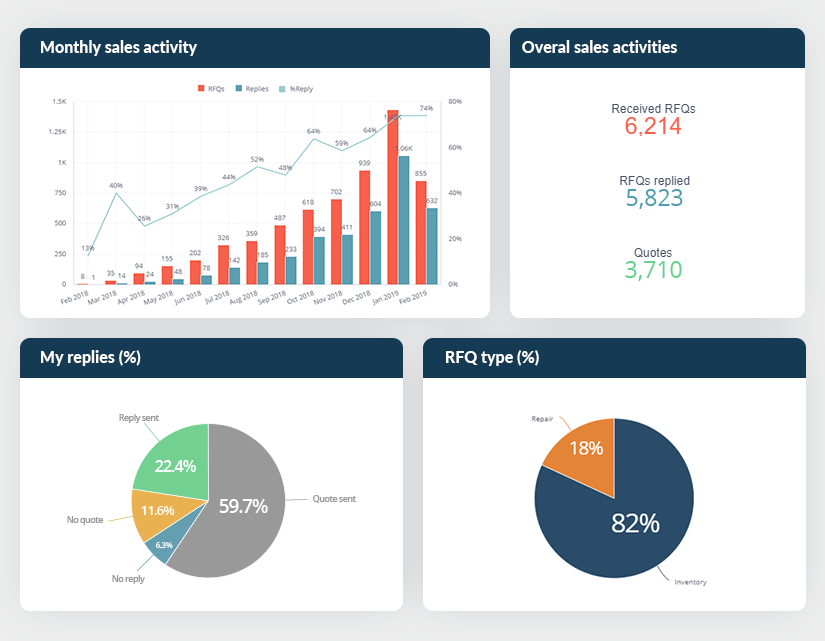
Sellers report
Access your dashboard anytime to review and analyze your daily sales activities: demands, RFQs, quotes, and replies. You can also drill down to view buyers and RFQs for each part, and more.


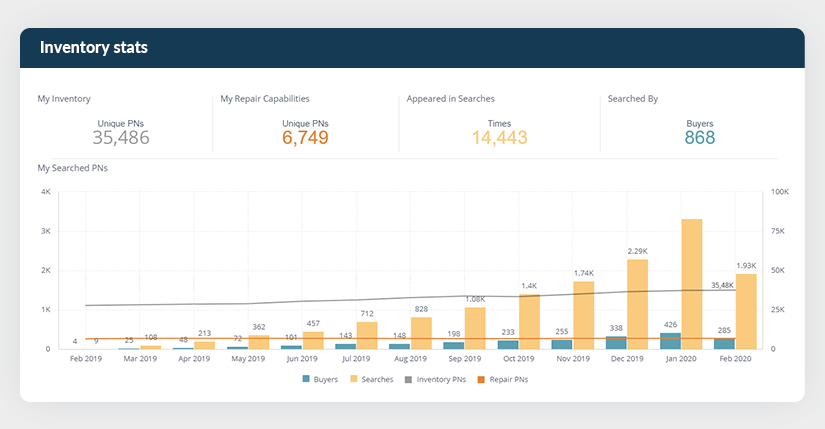
Sellers inventory analytics
Get a real-time overview of your inventory, capabilities, how many times you appeared in search results and more.


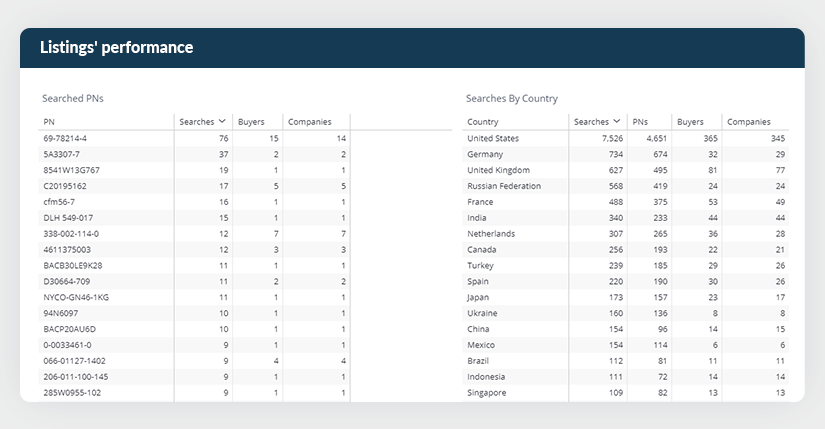
Drill down and review your listings’ performance: view your top searched PNs, how many potential buyers searched for your PNs, and from which location.

There you have it. One of the most innovative and advanced stats & analytics dashboard at your fingertips, for free.
Are you ready to boost your productivity?

We would love to get your feedback. Email us and tell us what you think.
Don’t have an account yet? Join ePlane now.


